dbachecks - Using Power BI dashboards to analyse results
For the last couple of months, members of the dbatools team have been working on a new PowerShell module called dbachecks. This open source PowerShell module will enable you to validate your SQL Instances. Today it is released for you all to start to use 🙂
dbachecks launch - the blog posts series
Here you can find a list of the blog posts made available today:
- introducing dbachecks - a new module from the dbatools team! by Chrissy LeMaire
- install dbachecks by Chrissy LeMaire
- dbachecks commands by Chrissy LeMaire
- dbachecks – Using Power BI dashboards to analyse results by Cláudio Silva
- My wrapper for dbachecks by Tony Wilhelm
- Checking backups with dbachecks by Jess Promfret
- dbachecks please! by Garry Bargsley
- dbachecks – Configuration Deep Dive by Rob Sewell
- Test Log Shipping with dbachecks
- Checking your backup strategy with dbachecks by Joshua Corrick
- Enterprise-level reporting with dbachecks by Jason Squires
- Adding your own checks to dbachecks by Shane O’Neill
- dbachecks - A different approach for an in-progress and incremental validation by Cláudio Silva
Other documentation:
Let’s begin
In this blog post, I will write about the Power BI dashboards that we have created to analyse the output of the tests.
Disclaimer
Here, at dbachecks team, we don’t have BI gurus. This means, that what you are about to see come from our non-BI minds plus some research on the web to achieve the output we wanted. The main objective is to have something functional, that helps to make decisions and help to know where we should look next. That being said if you master Power BI, M query language, DAX or other stuff that we have used or can be used on this project and you found some archaic or a too much year 2000 way to do some stuff, let us know! We would love to follow best practices and improve the dashboards.
Why Power BI? The background…
I started to work with Power BI after seeing a couple of sessions where it was and was not the main attraction. One of those sessions was from Rob Sewell ( b | t ) where he was showing Pester and, to show the output, he has used Power BI desktop. This means that he is the principal “culprit” for this choice 🙂. If, in addition to that, we join the ease of import the JSON (and other) files, the usefulness and the eye-candy dashboards all together made the decision easier. With this in mind, I picked the initial Power BI from Rob and started digging on it and make some changes.
Note: If your tool of choice is not Power BI or you just feel more comfortable using another tool to work with JSON files, please share your dashboards with us. Write about it and share with the community.
Tests output format
dbachecks output consists of one or more JSON files. When you write your dbachecks scripts you can choose between just one or more files as result of your validation. For instance, you can generate one output file per context or just one that includes all contexts. You can even use the -Append to append results to an existing file as Rob described on dbachecks – Configuration Deep Dive blog post.
Before opening the file that contains the dashboards…
For a more pleasant and smooth experience, we recommend that you update your Power BI desktop to the latest version.
Nowadays, Power BI’s team releases a new version every month. Each new version brings new features and improvements. Because we may be using the most recent version of Power BI (desktop) to take advantage of some of those, we also encourage you to use the most recent version. You can download it from the official Power BI website .
Note: If you try to open a Power BI file saved on a more recent version than the one you are using you may see an error message like:

This was the result of an attempt to open a file on the December 2017 version that was saved on a more recent (the February 2018) version.
Which file should I open? pbix or pbit?
dbachecks contains two different files:
- pbix - is a document created by Power BI Desktop. It contains queries, data models, visualizations, settings, and reports added by the user.
- pbit - is similar to pbix but it is a template. You can configure variables that will be asked when you open the file. Those can act, for instance, as filters.
By default, dbachecks will output the results to the “c:\windows\temp\dbachecks” folder. This folder is also the default one configured in the pbix file. This path is the only variable that we use on the pbit file, which means if you don’t need to change your path because you relied on the default one, you can just open the pbix file and click refresh.
On the other hand, the intent of the pbit file is to make it easy for people that are not so comfortable with Power BI desktop, this way they just need to type their output folder (where all the JSON files are) and they are ready to go. Where this is different from the other file? On the other file (“pbix” extension), you need to go to edit queries menu in order to change your path. This is a more “advanced way” to do it, so if you just want to start to see your tests results in a beautiful way, you can open the template file (“pbit” extension), fulfil the requested path, hit Load and wait for it to load all of your results.
Note: When using pbit, if no objects appear, please make sure you have entered the correct path. Wrong paths will lead to empty dashboards.
You have opened the pbix file but you are not seeing (your) data?
The pbix file will keep the last data you saw on the dashboard. If you have rerun all or some tests, don’t forget to click the “Refresh” button!

Only after refreshing the data source you will get all the data (re) loaded and thus get the most recent version of it.
The dashboards
On this liftoff of dbachecks, our Power BI file includes two dashboards.
If you never used Power BI before you may not know that you can maximize just one visual (almost any type) and come back to the report whenever you want. This is cool when you have a lot of information and you want to take a closer look.
See this example (click to open on new window):
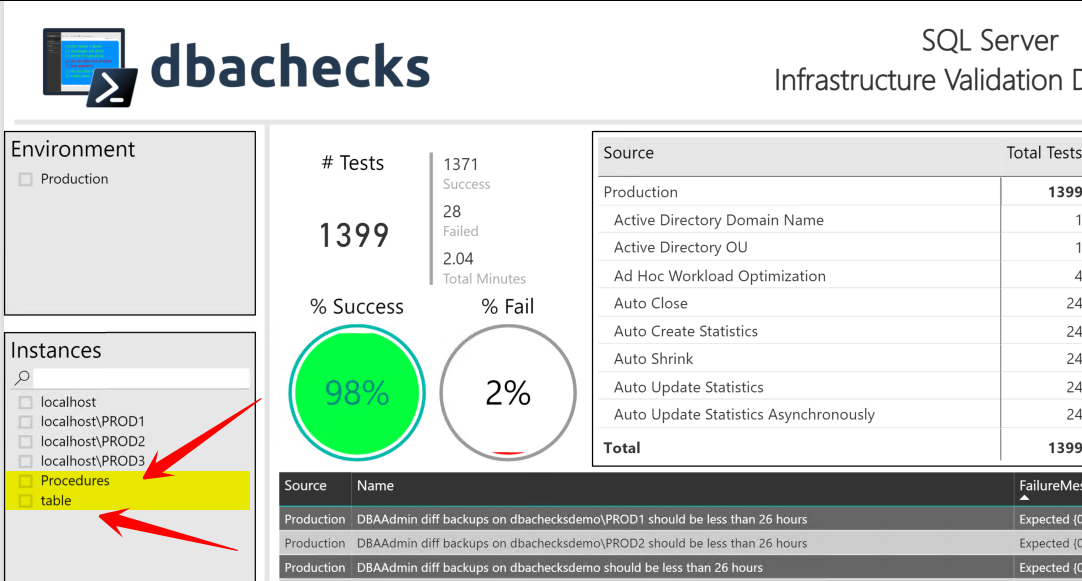
By Environment
This dashboard gives to you a glance at how good/bad your environments are. This is done, at first, by the 2 circles with percentages and green/red waves.
On the right side you can find a matrix where you can drill-down from Environment -> Test -> Context. This drill-down can be hierarchical or absolute. To navigate on the levels, select the matrix and use the 3 buttons in the top-left corner of the visual (as shown on the last animation)
On the bottom, you can find a grid that shows all the failed (and only failed) tests with a descriptive message.
To help you to read this dashboard, on the left side you have the quick filters by Environment and Instance. There are two other ways to filter the information - you can select a row on the matrix or on the grid to see information just related to that row. Example:
By Time
The main objective of this dashboard is helping you to understand which tests take the most time to run. Bear in mind that the times you will see are just the time that one test or the sum of tests took. The time switching between tests are not accounted.
I use this dashboard to understand which tests should/can be running in parallel and that way make the full execution faster. Also, you can decide that some tests don’t need to run on the same frequency than others.
On the next example, I can see that my Production environment is the one taking the most time to complete, then I filter by it and I can see that the “Testing duplicate indexes” and “Testing Column Identity Usage” are the ones that take the most time. If I want, I can exclude them from the bar chart just to take a closer look at the other test times. Finally, I can go to the filters and remove them resetting the bar char right where we started.
Take a look:

Rules
Yes, there are some rules :-)
To accomplish these dashboards, some rules must be followed. For example, the “Context” message needs to follow a specific nomenclature. You can read more about it on our wiki on Github . If these rules are not followed when writing the tests, you can see some weird results on the dashboards.
On this example, you can see six instances, but the last two “Procedures” and “table” appear because the test wasn’t write in the right way.
Also, we have a unit test to help you check for these “Context” rules!
Dynamic
The data source on the Power BI was built to be dynamic. Because we can output just 1 test result per file (a record) or multiple results in the same file (a list), we built it so they can live together!
Load times
You may be thinking how fast it is to load the data and apply all the transformations we have to the files. We had that in mind and we tried to reach a good performance on that task. I can load 270 files, totalling 397MB of data, in less than 30 seconds (the time will vary depending on the machine specifications).
If you are curious, each file contains a single test for every instance in a specific environment. At that time I managed 7 environments with more than 100 instances.
Next steps?
Now you can run your tests, analyse the output, make the changes needed, rerun the tests and start seeing your green percentage going up and the number of errors going down!
Our next objectives
We will bring some new dashboards and improve the existing ones whenever possible. If you have a case that you would like to see covered by a dashboard share with us. Do you already have it sort out? Share with us and we can replicate to our file.
It’s Open Source – We Want Your Ideas, Issues, New CodeNew Code
dbachecks is open-source available on GitHub for anyone to contribute .
We would love you to contribute. Please open issues for new tests, enhancements, bugs. Please fork the repository and add code to improve the module. please give feedback to make this module even more useful.
You can also come in the SQL Server Community Slack and join the dbachecks channel and get advice, make comments or just join in the conversation.
Thank You
I want to say thank you to all of the people who have enabled dbachecks to get this far. These wonderful people have used their own time to ensure that you have a useful tool available to you for free
Chrissy Lemaire @cl
Rob Sewell @sqldbawithbeard
Fred Weinmann @FredWeinmann
Stuart Moore @napalmgram
Shawn Melton @wsmelton
Garry Bargsley @gbargsley
Stephen Bennett @staggerlee011
Sander Stad @SQLStad
Jess Pomfret @jpomfret
Jason Squires @js0505
Shane O’Neill @SOZDBA
and all of the other people who have contributed in the dbachecks Slack channel