Search for queries with Query Store GUI
Hey folks, long time no write!
Today I want to bring a tip that I use every week but I found that most SSMS users are unaware it exists.
I can understand why! At the moment this isn’t the most obvious and user-friendly option. However, it can and hopefully it will improve in the future.
“But…What is it?”
I’m talking about using the Query Store GUI to search for some portion of text used in a T-SQL query and, with that, find a query that you want to analyze within it.
What is Query Store?
From the documentation :
The Query Store feature provides you with insight on query plan choice and performance…
… simplifies performance troubleshooting by helping you quickly find performance differences caused by query plan changes. Query Store automatically captures a history of queries, plans, and runtime statistics, and retains these for your review.
As a reminder, Query Store made its first appearance on SQL Server 2016. With SQL Server 2022, it even comes on by default when you create a database. Until 2022 when you create a new database or if you are doing a migration where the feature was not turned on for the database, you will need to turn it on by yourself.
Another remark to be made is that this feaute is available not only on SQL Server on-premises but also on Azure SQL Database, Azure SQL Managed Instance and Azure Synapse Analytics (dedicated SQL pool only).
Query Store dashboards
SQL Server provides 7 different dashboards so you can check the queries and analyze the execution plan changes, compare them, among other options
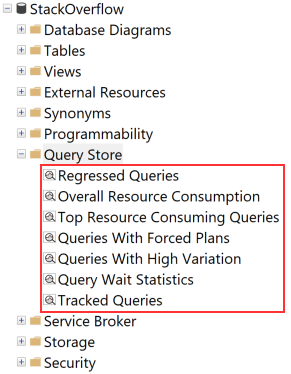
Back to the main question - How can we search for specific queries using the GUI?
If you arrive on this page, most probably you were searching if/how it’s possible to use the GUI to search for specific queries.
As mentioned before, the GUI for that is far from being intuitive, but it exists!
Let’s do it step by step - you need to:
- Open the
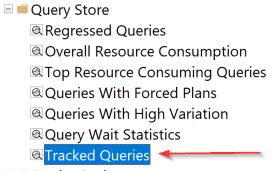
Tracked Queriesdashboard (you can also open this dashboard from theTop Resource Consuming Queriesby clicking the “target” icon that will one the selected query)
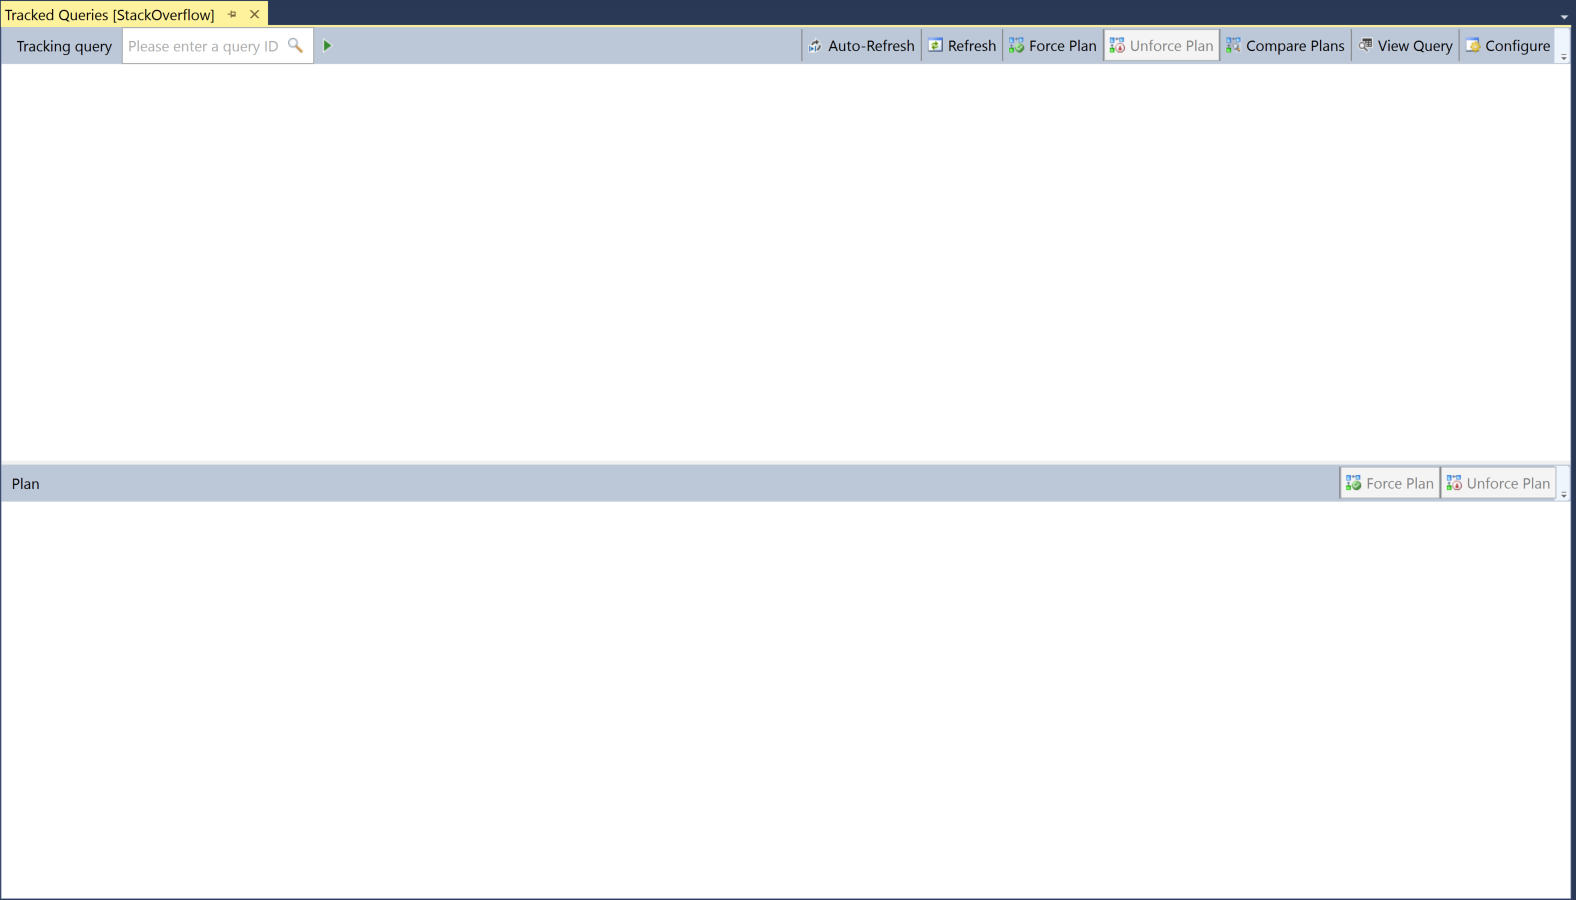
This will open the dashboard:
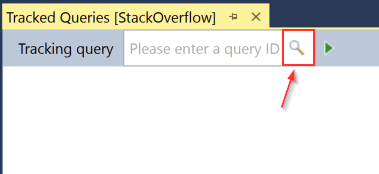
- In the top left corner, click on the magnifier glass that is between the
Please enter a query IDand thePlaybutton
- A new screen will pop up!
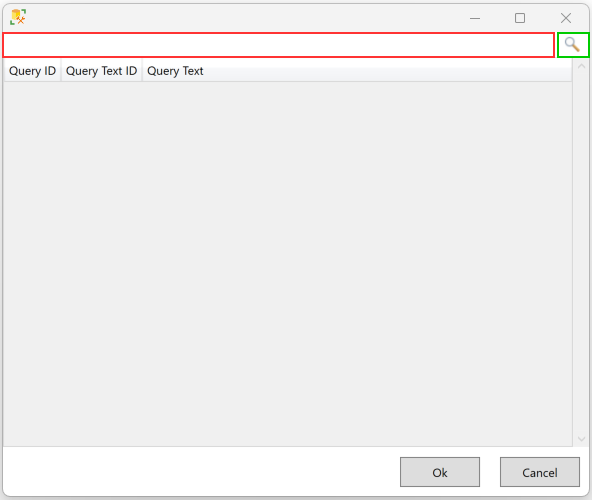
On that screen, you have a top white text box (red rectangle). There, type a portion of the query text you want to find. At the end of the text box, we have another magnifier glass button. Click on that button to trigger the search (or hitEnter).
- If something can be found, it will be listed below. You can mouse hover to see (as a tooltip) the query text, which can give you an idea if it is the one you want to find.
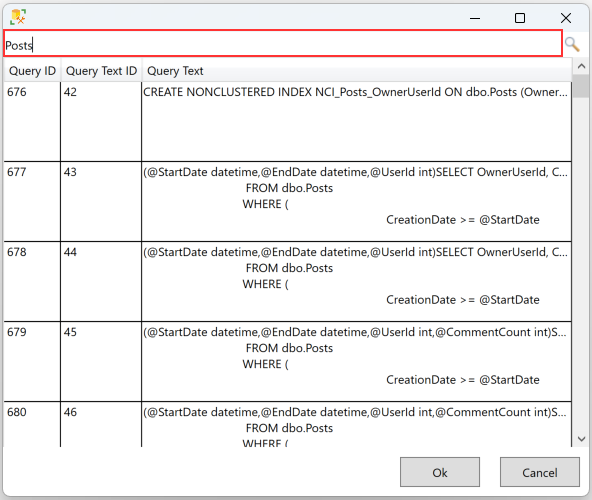
Select the row containing the query you want to analyze and click
OK
That will put the
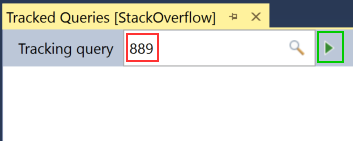
Query IDwhere before we had thatPlease enter a query IDplaceholder (red rectangle). Now, you can hit thePlaybutton (green rectangle) so it will do the search for that query ID and show some Query Store graphics.
- That will show some results
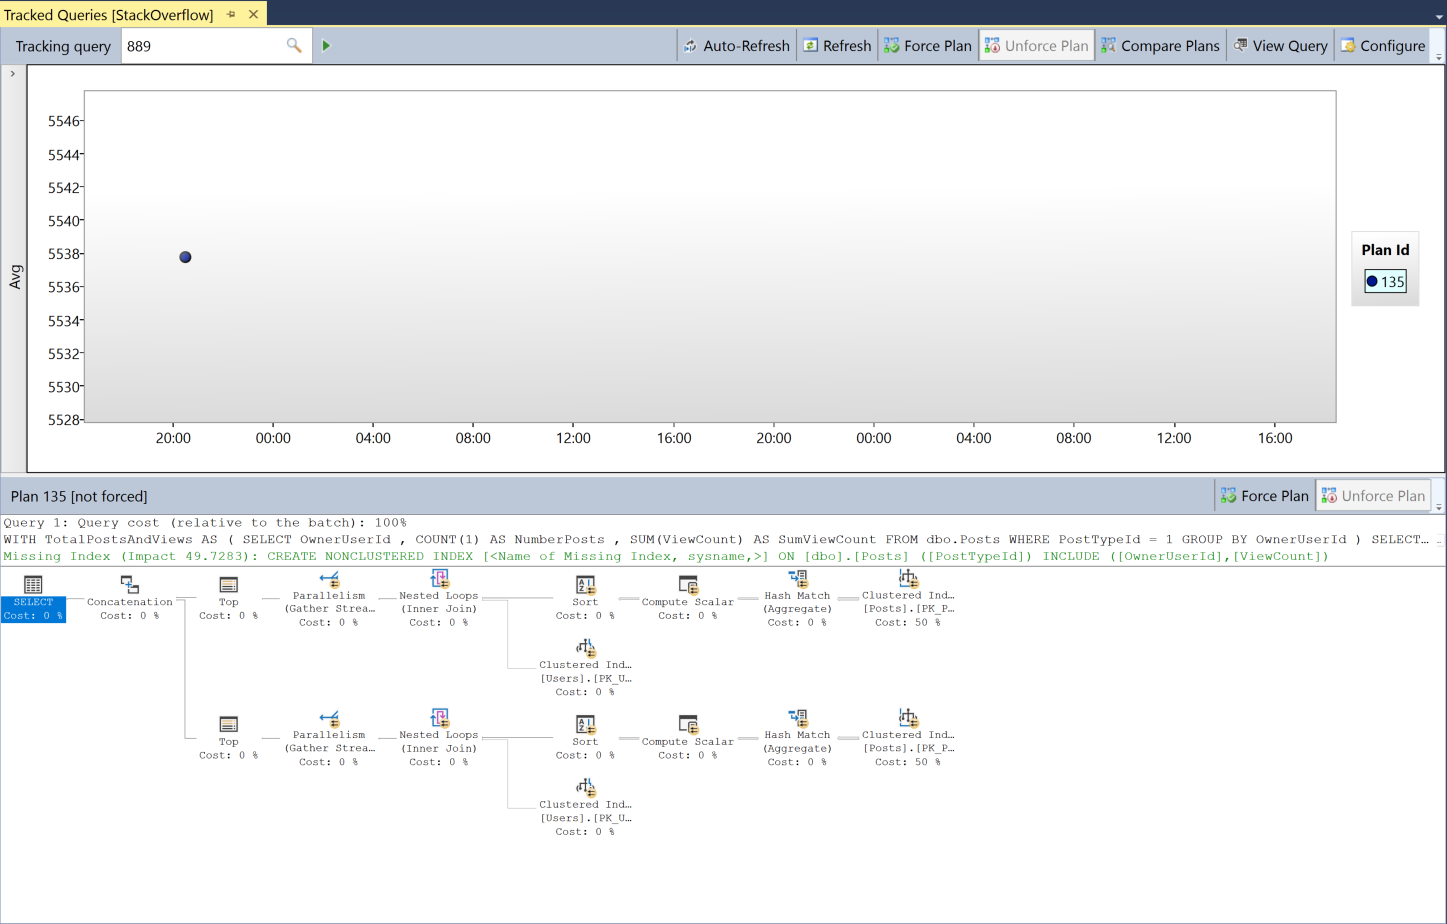
Not bad!
“That seems very limited”
If you weren’t aware of it until now, this is another “tool” on your belt. It’s something! 😉
I would say is better than nothing.
To be fair depending on the size of your Query Store the search works relatively fast.
However, if you, like me, kind of live inside SSMS and do a lot of performance tuning analysis, I would suggest you take a look at sp_QuickieStore from Erik Darling ( blog ).
This stored procedure allows you to do much more granular filtering using a lot of different parameters and is way faster then the GUI.
With the results, you can pick the query_Id you want and use it directly on the dashboard if you want.
What’s my use case?
My real-life examples are when I want to take some screenshots to share with clients to show/explain a performance gain/degradation or even a pattern. You may have different reasons.
Hope you find it useful.
Thanks for reading it.
